
A Guide to the Trends Feature
The Trends feature in StoriiCare provides a visual overview of key numerical data points related to participant engagement, staff activity, and overall StoriiCare usage over time. It helps you monitor patterns, identify changes, and support data-driven decision-making.
Accessing the Trends Page
From your StoriiCare dashboard, click on Trends.
This page displays charts that map important metrics across customizable time periods.
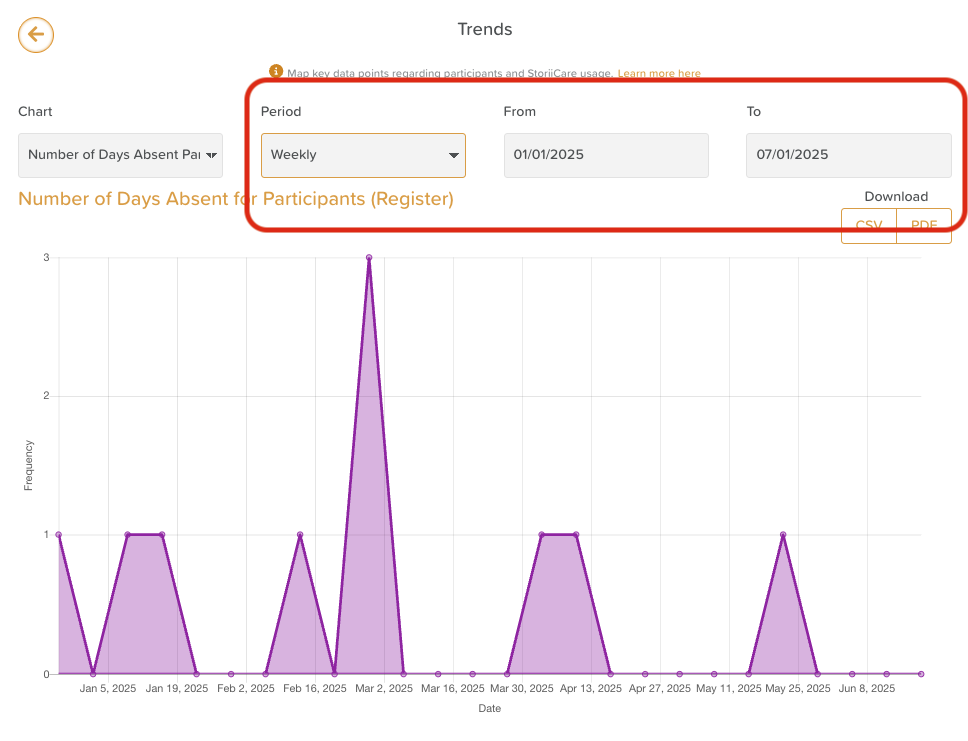
Setting Your Date Range
You can view data for a specific time frame by:
Selecting a period — choose from daily, weekly, monthly, or yearly.
Adjust the From and To date fields to define your desired range.
This flexibility allows you to easily track short-term changes or long-term trends.
Data Points Available in Trends
StoriiCare’s Trends feature offers a wide range of measurable data points that can be charted.
Commonly Tracked Metrics Include:
Incidents and Accidents Reported
Participant Sign-Ins
Staff Sign-Ins
Participant Absences
Staff Absences
New Staff Members Added
Deactivated Staff Members
New Participants Added
Deactivated Participants
New Family Connections Created
…and more!
These charts provide a clear numerical overview of your organization’s operational activity across different timeframes.
Is there a chart you'd like to see added to our selection? Let us know on our Feature Request board!
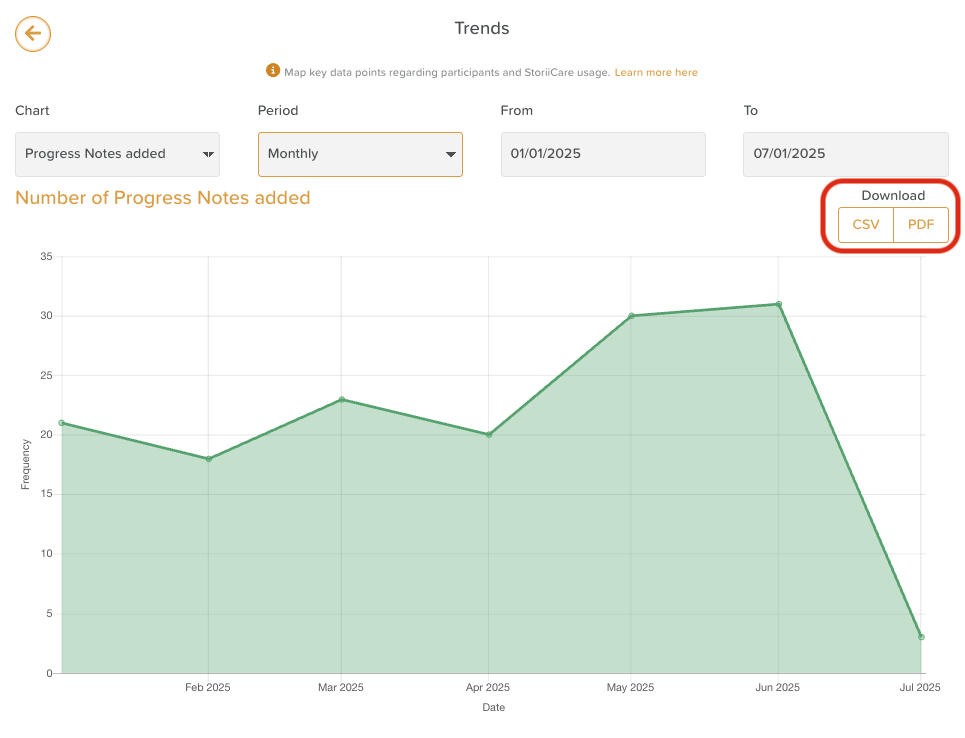
Exporting Data
All data shown in the Trends feature can be exported for reporting, auditing, or further analysis.
You can export as:
CSV – ideal for detailed analysis in Excel or Google Sheets.
PDF – for printable and shareable reports.
Simply click the Export or Download button at the top of the page and choose your preferred format.
Important Notes
The Trends feature displays numerical data only.
It does not capture or display the names of staff or participants.
Each chart reflects aggregate counts and totals within the selected date range.
💡 Example: A monthly report showing 12 “participant absences” indicates that 12 absences were logged that month — not who was absent.
Need More Help?
If you need further assistance, you can reach out to our support team by emailing support@storii.com. Our support team is ready to help you with any questions or issues you may have.