
A Guide to the Analytics Feature
The Analytics feature in StoriiCare helps you visualize and measure key data points across your service — including activity engagement, form responses, and participant demographics. With powerful filtering options and export capabilities, Analytics makes it easy to track trends, demonstrate outcomes, and support reporting requirements.
Accessing the Analytics Feature
From your StoriiCare dashboard, click on Analytics.
You’ll see a Chart dropdown that includes three primary categories of charts:
Activity Analytics
Face Sheet Analytics
Form Analytics
Additional analytics are also available for Tasks and Feature Usage.
Filtering Data
Use the filter tools at the top of the Analytics page to refine your results. You can filter by:
Participants – View analytics for a specific individual.
Groups – Compare data across locations, programs, or service types.
Date Range – Focus on a specific reporting period (e.g. last week, quarter, or year).
This flexibility helps tailor reports to your organization’s goals or compliance requirements.
Exporting Data
All charts and analytics views can be exported for reporting or sharing.
You can download your data as:
CSV – For further analysis in Excel or Google Sheets.
PDF – For printable summaries and reports.
Simply click the Export or Download icon in the top-right corner of the Analytics page, then select your desired file format. Some charts will only be available in CSV format.
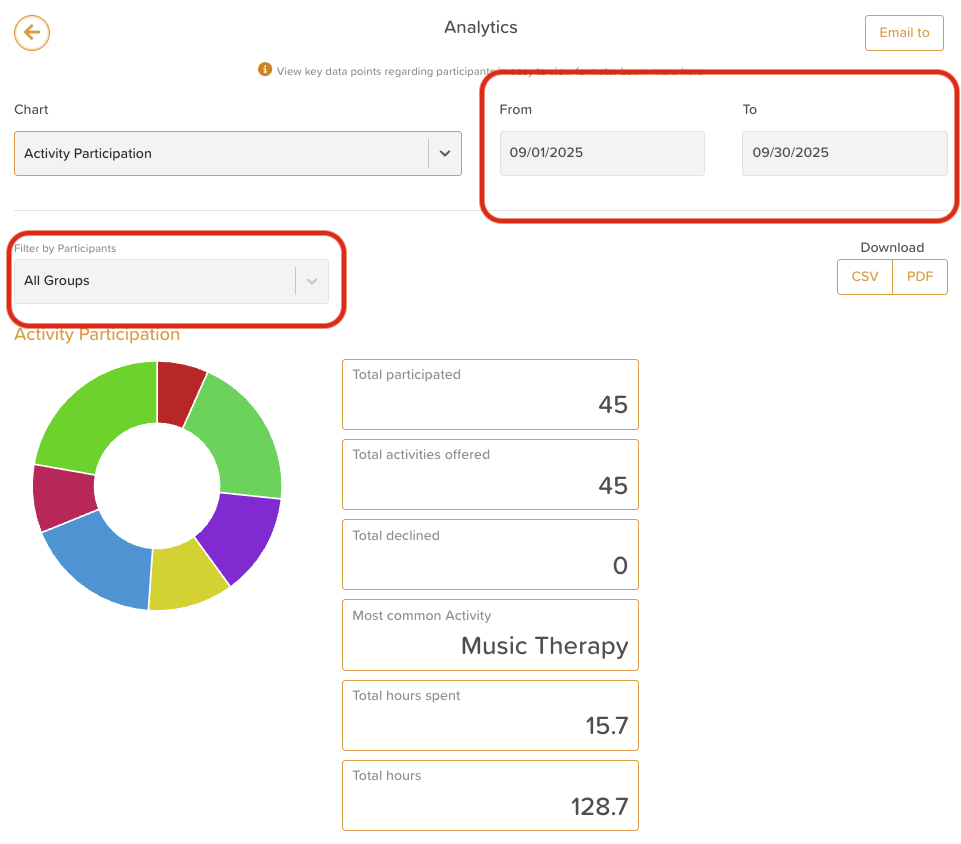
1. Activity Analytics
Activity Analytics displays participation and engagement data gathered from completed activities. These charts help you understand how active and engaged your participants are, and which programs are most popular.
Available Data Points:
Total Participated – Number of participants who attended activities.
Total Engagements – Activities x number of participants attended.
Total Activities Offered – The number of unique activity sessions scheduled.
Total Declines – The total number of times participants declined to attend.
Total Engagement Hours – Activity duration x participants attended.
Total Hours Spent – The total combined time participants spent in activities.
Additional Charts:
Most Common Activity Types – Identifies which categories (e.g. Physical, Social, Educational) occur most frequently.
Most Common Tags – Displays which activity tags (e.g. Morning, Group, Outdoor) are most often used.
These insights can help you evaluate participation trends, optimize scheduling, and demonstrate engagement outcomes to stakeholders or funders.
Activity Analytics Emails:
Users can have Activity Participation and Most Common Activities analytics reports emailed to them at their preferred frequency.
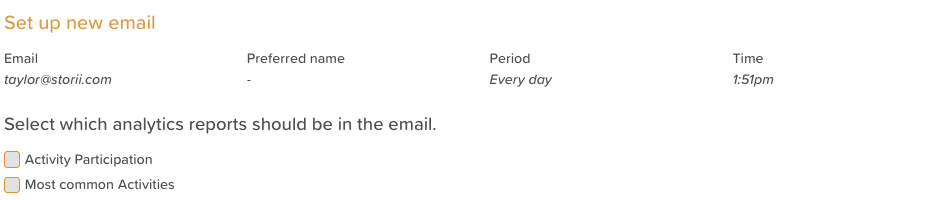
To set up these emails, click on the Email to button (top right)
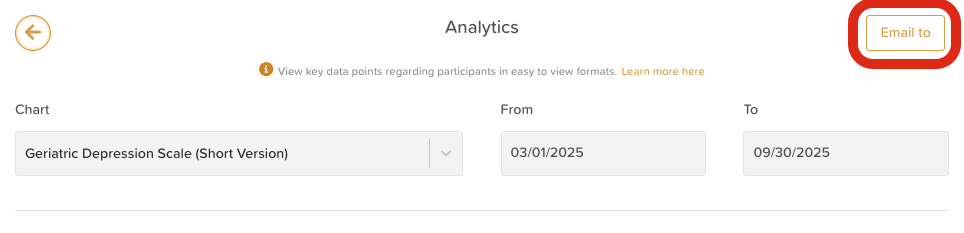
When adding a new email, enter the individual's email address, preferred name, frequency period (e.g. every other day, every day, monthly, weekly, etc.) and email delivery time.
Then, check the box(es) for which reports are to be included:
Would you like to see more reports included here? Let us know on our Feature Request board!
2. Face Sheet Analytics
Face Sheet Analytics summarizes demographic or background data about your participants.
Any Face Sheet field with “Show in Analytics” toggled on (via your Face Sheet Template Settings) will automatically appear here.
For example, you may track participant details such as:
Gender distribution
Primary language
Diagnoses or care levels
Service type or funding source
💡 Tip: Customize which fields appear by editing your Face Sheet template. Toggle “Show in Analytics” on or off for each field as needed.
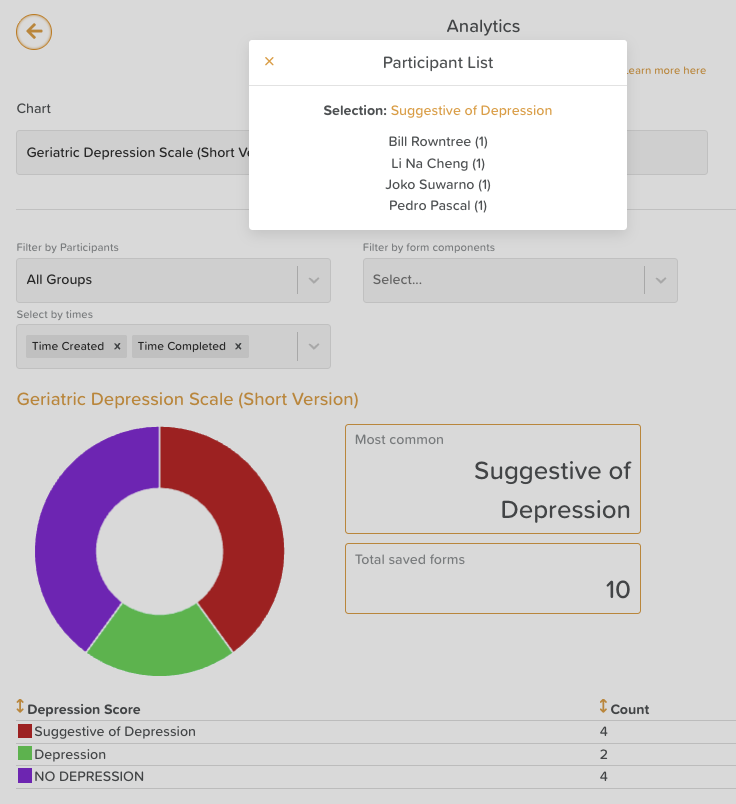
3. Form Analytics
The Form Analytics category gathers data from submitted forms created through Form Builder.
Any form component with “Include in Analytics” checked in the Form Builder will populate here once responses have been collected.
Interactive Charts:
Each form chart typically appears as a pie chart, showing response distribution.
Click on a segment of the chart to see which participants are included in that response.
⚠️ This interactive functionality is currently only available for Form Analytics but will be added to other Analytics charts in a future update.
Additional Analytics
StoriiCare also includes general analytics charts for:
Most Common Task Types – Tracks which task categories are created and completed most often.
Most Common Features – Shows which StoriiCare features (e.g. Activities, Notes, Forms) your team uses most frequently.
These charts can be valuable for reviewing staff engagement and workflow efficiency.
Need More Help?
If you need further assistance, you can reach out to our support team by emailing support@storii.com. Our support team is ready to help you with any questions or issues you may have.